
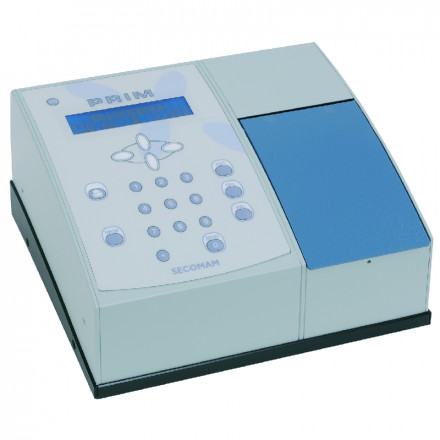
Le milieu réactionnel est constitué d’un mélange de deux solutions aqueuses.5mL de peroxodisulfate à 0.025mol/L et 25mL d’ions iodure à 0.005 mol/L. On effectue un suivi cinétique à 450nm ave une mesure d’absorbance toutes les deux minutes pendant huit heures.
http://yb-isn.fr/cinetique.csv
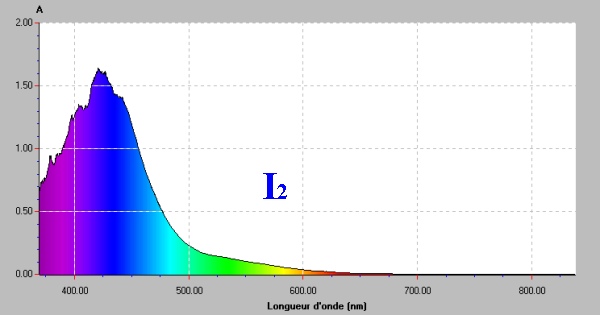
Le fichier csv qui est en ligne: doit être exploité pour obtenir les tracés ci-dessous.
import pandas as pd
import numpy as np
import matplotlib.pyplot as plt
df=pd.read_csv('http://yb-isn.fr/cinetique.csv',encoding="cp1252", sep=';',header=0)
t=df['t'].values.tolist()
A=df['A'].values.tolist()
VA=5E-3
CA=0.025
VB=25E-3
CB=5E-3
NAi=CA*VA
NBi=CB*VB
NCi=0
NDi=0
t_h=np.array(t)/3600
A=np.array(A)
Ainf=A[-1]
Cinf=(0.0025*5)/30
C=1000*Cinf*A/Ainf
plt.scatter(t_h,A,s=2,c='green')
plt.grid()
plt.ylabel('Absorbance à 450nm')
plt.xlabel('temps (h)')
plt.show()
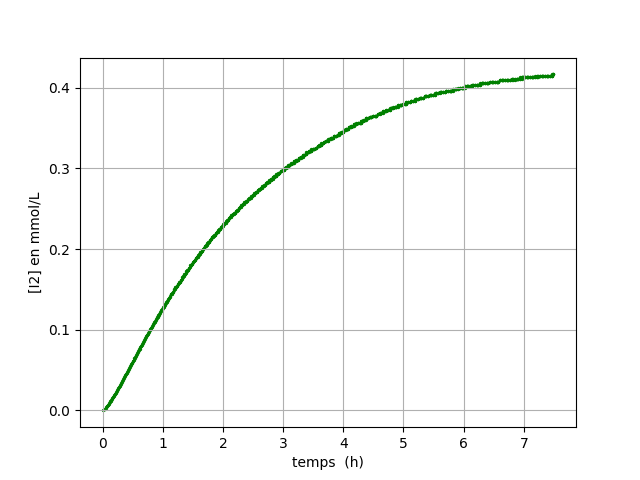
plt.scatter(t_h,C,s=2,c='green')
plt.grid()
plt.ylabel('[I2] en mmol/L')
plt.xlabel('temps (h)')
plt.show()
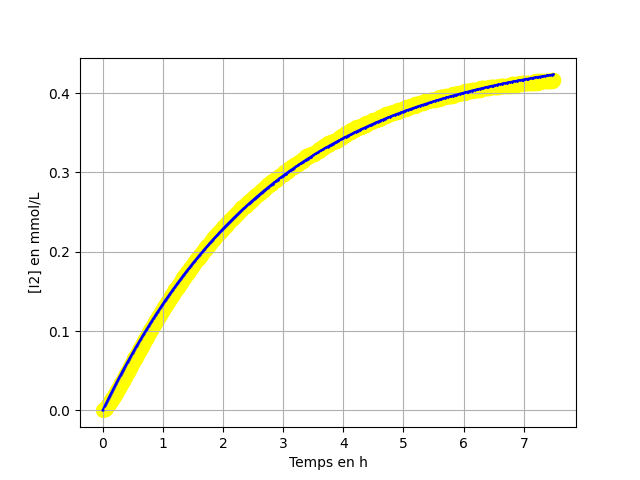
modélisation
import pandas as pd
import numpy as np
import matplotlib.pyplot as plt
#from pylab import *
import scipy
from scipy.optimize import curve_fit
df=pd.read_csv('http://yb-isn.fr/cinetique.csv',encoding="cp1252", sep=';',header=0)
t=df['t'].values.tolist()
A=df['A'].values.tolist()
VA=5E-3
CA=0.025
VB=25E-3
CB=5E-3
NAi=CA*VA
NBi=CB*VB
NCi=0
NDi=0
t_h=np.array(t)/3600
A=np.array(A)
Ainf=A[-1]
Cinf=(0.0025*5)/30
C_I2=1000*Cinf*A/Ainf
coef,cov=scipy.optimize.curve_fit(lambda x,a,b: a*(1-np.exp(-x/b)), t_h, C_I2)
a=coef[0]
b=coef[1]
print(coef)
Cmodel=a*(1-np.exp(-t_h/b))
plt . scatter(t_h ,C_I2,s=100,color ='yellow')
plt . plot (t_h ,Cmodel,marker=".",color ='blue',markersize=1)
plt . ylabel ("[I2] en mmol/L")
plt . xlabel ("Temps en h")
plt . grid ()
plt .show()
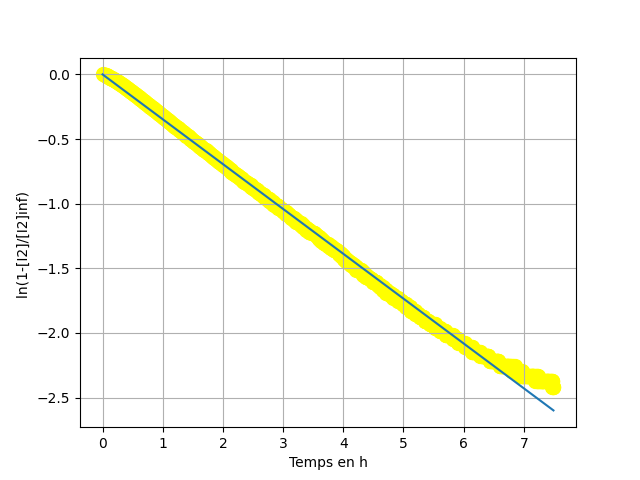
lc=np.log(1-C_I2/a)
plt . scatter(t_h ,lc,s=100,color ='yellow')
plt.plot(t_h,-1/b*t_h)
plt . grid ()
plt .show()